Abstract
The newly released enrollment data from the National Center on Education Statistics for the 2022–23 school year point to moderate enrollment gains for traditional public schools. The recent enrollment gains though are smaller than the cumulative enrollment losses since 2019–20 and are not uniform. This paper takes stock of enrollment losses today by comparing the distribution of changes in public school enrollment since the COVID-19 pandemic to the distribution of pre-pandemic changes across the nation. Roughly 59, 69, and 69 percent of small, medium-sized, and large schools, respectively, saw their enrollment decline between 2019–20 and 2022–23. One third of small, medium-sized, and large schools with enrollment declines lost 26, 54, and 96 students or more, respectively (i.e., top third). The share of schools experiencing such declines after COVID-19 is larger than what would be expected based on historical variation for medium-sized and large schools. Urban schools and middle schools are disproportionately represented among schools with enrollment losses in the top third.

Introduction
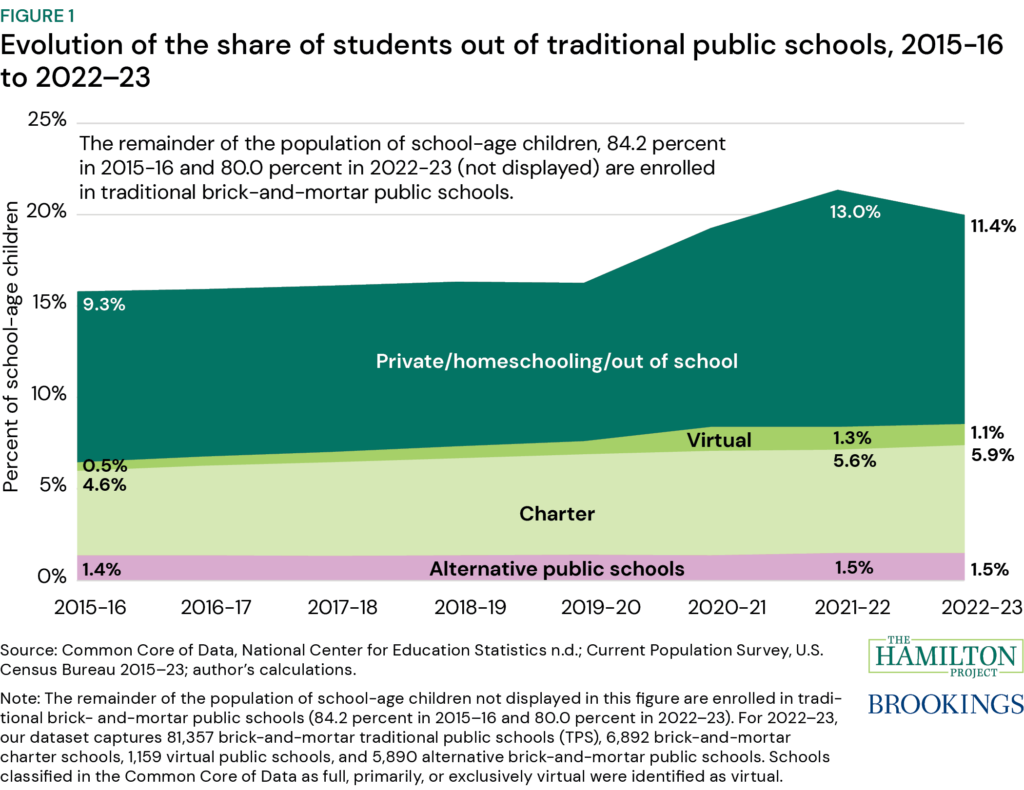
In a prior THP paper, we documented the declining school enrollment across the nation between 2019–20 and 2021–22. We showed that the share of school-age children attending traditional brick-and-mortar public schools declined from roughly 84 percent in 2019-2020 to 79 percent in 2021–2022. This decline is associated with an increase in the share of school-age children outside the public school system entirely. This updated analysis uses newly released enrollment data for 2022-23 from the National Center for Education Statistics to take stock of enrollment declines today and provide historical benchmarks of enrollment changes.
I find that while the share of students attending traditional public schools (TPS) remains below its pre-pandemic level in 2022–23, it increased by roughly 1 percentage point between 2021–22 and 2022-23. This paper also compares the distribution of changes in public school enrollment after COVID-19 (i.e., the three-year change between 2019–20 and 2022–23) to the distribution of pre-pandemic changes (i.e., all three-year windows between 2011–12 and 2019–20) across the nation. I find that the majority of schools experienced declining enrollment between 2019–20 and 2022–23. This paper then investigates the variation in school-level enrollment through the 2022–23 school year for schools in three size categories based on pre-pandemic enrollment: small, medium, and large. I also provide historical benchmarks of enrollment declines in each size category to identify atypical changes in school enrollment in different communities.
I find that small (59 percent), medium-sized (69 percent), and large (69 percent) schools saw their enrollment declining between 2019–20 and 2022–23. The top third of declines between 2019–20 and 2022– 23 is used to define a relatively high level of decline. This translates to losing at least 26, 54, and 96 students for small, medium-sized, and large schools, respectively. In the three-year window between 2019– 20 and 2022–23, small (21 percent), medium-sized (23 percent), and large (23 percent) schools experienced a relatively high level of enrollment decline. This is large by historical standards; for example, averaging across all three-year windows between 2011–12 and 2019–20, only 18, 15, and 12 percent of small, medium-sized, and large schools experience relatively high enrollment decline. Binomial tests show that the share of schools experiencing a relatively high level of declines between 2019–20 and 2022–23 is outside the range of the share of schools experiencing such declines before COVID-19 with statistical confidence for medium- sized and large schools. Urban schools and middle schools are disproportionately represented among schools with enrollment losses in the top third.


