For immigrants to work in the United States legally, they generally must obtain work authorization. Immigrants with particular legal statuses, such as those seeking parole or asylum status, request authorization by applying for Employment Authorization Documents, commonly called work permits.
Tracking work permit applications can illuminate how changes in the pace of immigration are affecting labor supply. If immigration policy changes or other factors dampen net migration to the United States, work permit applications should be an early indicator of how much the decline in immigration will slow labor force growth. This data tool shows work permit applications and outcomes. By following permit applications and approvals, we can get a sense of how immigration restrictions are likely to affect labor supply growth over time. An analysis of the relationship between work permit applications and their potential effect on labor supply as of January 2025 is available here.
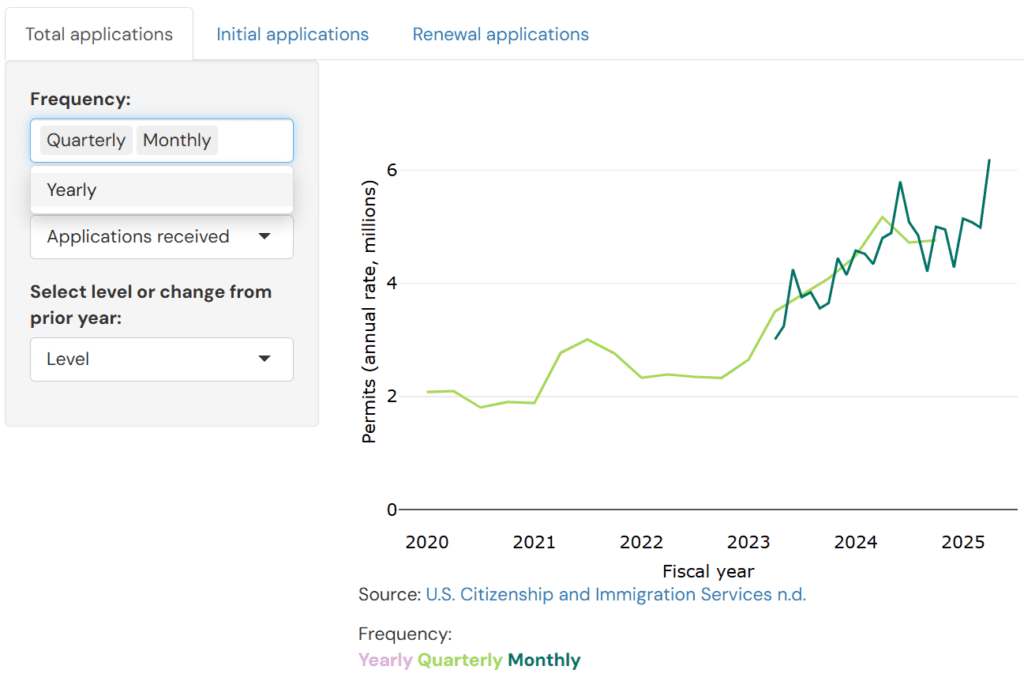
The data are organized by fiscal year; a given fiscal year begins in October of the prior calendar year and ends the following September. All data are annualized so that data series of differing frequencies are comparable. Users can view non-annualized values for quarterly and monthly data when hovering over data points. No other adjustments are made to the data.
Step one: Select “Total applications,” “Initial applications,” or “Renewal applications”
Users must first select a tab indicating which application type they want to view: total, initial, or renewal.
In the “Total applications” tab, users can select all, some, or one of the available frequencies (yearly, quarterly, or monthly). Removing annual data from the graph will allow users to “zoom in” on more recent data. Total applications also include “replacement” and “not requested” permits, which are not separated out in this tool (or related analysis).
For initial and renewal applications, users do not have the option to select a frequency; the data are available only for fiscal years.

Step two: Select outcome
Users then select the application outcome using the search/dropdown tool on the left. The “Initial applications” and “Renewal applications” tabs populate only with outcomes available by fiscal year: receipts, approvals, and denials.

Under the “Total applications” tab, more outcomes are available. These outcomes include receipts, approvals, and denials, as well as pending applications, applications pending for more than six months, and average processing time. These measures update monthly and quarterly.

Step three: Select “level” or “change from prior year”
Lastly, users may also select “Level” or “Change from prior year.” “Change from prior year” measures the difference between the current period and the same period in the prior year (year-over-year prior; quarter-over-four quarters prior; month-over 12-months prior).

Series in the “Total applications” tab will update monthly and quarterly with new data. Initial and renewal application data are only available in annual format, which is generally released two to three months after the end of the fiscal year.